

Imagine you’re standing in a courtroom. You’ve spent months—maybe years—digging through discovery, interviewing witnesses, and refining your legal theory. You know the facts. You have the evidence. But as you look at the jury, you see it: the glaze. That subtle, unmistakable look of mental fatigue.
Most jurors aren’t lawyers. They don’t spend their days parsing through 500-page depositions or analyzing the nuance of a statutory interpretation. To them, a complex case can feel like a mountain of disconnected dates, names, and documents. If you present your case as a series of oral arguments and paper exhibits, you’re asking the jury to do a lot of heavy lifting. You’re asking them to build the map of the case in their heads while you talk.
The problem is, if the jury builds the map wrong, they’ll reach the wrong conclusion.
This is where visual case storytelling comes in. It’s not about “decorating” your presentation or using flashy graphics. It’s about cognitive load. By translating a dense sequence of events into a visual narrative, you stop asking the jury to imagine the timeline and start showing it to them. When a jury can see the gap between a defendant’s statement and the actual timing of an event, the evidence becomes self-evident.
Winning over a jury isn’t just about who has the better law; it’s about who tells the most digestible story. In this guide, we’re going to break down the psychology of visual storytelling and how you can use specific techniques—and tools like TrialLine—to turn a chaotic set of facts into a winning narrative.
The Psychology of How Jurors Process Information
To use visual storytelling effectively, you first have to understand how the human brain handles information. There is a concept in cognitive psychology called the “Picture Superiority Effect.” Essentially, humans remember images far better than they remember words. If you tell a juror a date, they might remember it for a few minutes. If you show that date on a linear timeline relative to other events, it becomes a mental landmark.
The Burden of Cognitive Load
Every time you introduce a new piece of evidence or a new witness, you add to the jury’s cognitive load. If the information is unstructured, the brain spends more energy trying to organize the data than it does analyzing the merits of the argument.
When you use a visual aid, you offload that cognitive work. Instead of the juror thinking, “Wait, did the email come before or after the meeting?” they simply look at the screen. This frees up their mental energy to focus on the why and the how—the actual heart of your case.
Narrative Transportation
Have you ever been so engrossed in a movie that you forgot where you were? That’s called “narrative transportation.” While a trial isn’t a movie, the goal is similar. You want the jury to be transported into the sequence of events. A visual timeline acts as the “GPS” for this journey. It provides a constant point of reference, ensuring that no matter how far you digress into a specific exhibit, the jury always knows exactly where they are in the story.
Designing the Narrative Arc of Your Case
Before you touch a piece of software or open PowerPoint, you need a narrative arc. A visual timeline is only as good as the story it tells. If you just plot every single event that happened, you haven’t created a story; you’ve created a calendar.
Identifying the “Critical Path”
Not every event in your discovery is relevant to the jury. Including too much “noise” can be just as damaging as leaving out key facts. The “critical path” is the shortest sequence of events that proves your theory of the case.
Ask yourself:
- What is the one thing the jury must believe for us to win?
- Which events directly support that belief?
- Which events contradict the opposing side’s theory?
Everything else is secondary. When building your visuals, emphasize the critical path. Use color coding or larger markers for these “anchor events” and keep the supporting details smaller or tucked away until they are needed.
The Power of the “Gap”
Some of the most persuasive visual storytelling doesn’t focus on what is there, but what is missing. In a visual timeline, a gap is a loud statement.
For example, if a company claims they performed “rigorous safety checks” every week, but your timeline shows a three-week gap right before an accident, that visual void speaks louder than any closing argument. By visualizing the sequence, you make the omission an exhibit in itself.
Practical Visual Techniques for the Courtroom
Now that we have the psychology and the arc, let’s talk about the actual execution. How do you turn a legal theory into a visual that a 12-person jury can understand in thirty seconds?
1. The Linear Chronology
The bread and butter of legal visuals is the linear timeline. It’s simple, it’s intuitive, and it’s hard to argue with. However, most attorneys make the mistake of making these too crowded.
- Avoid Clutter: Don’t list every email. Group them. Instead of “Email 1, Email 2, Email 3,” use a single block labeled ” series of 15 warning emails.”
- Use Anchor Points: Use distinct icons for different types of events (e.g., a phone icon for calls, a document icon for filings). This allows the jury to categorize information at a glance.
- The “Zoom” Method: Start with a high-level overview of the entire case (the “bird’s eye view”). Then, as you move into a specific witness’s testimony, “zoom in” to a detailed view of just that specific week or day.
2. Comparison Timelines (Parallel Tracks)
In complex litigation, you often have two different versions of the truth: yours and the opposing counsel’s. A parallel timeline is an incredibly powerful tool for impeachment.
Imagine a slide with two parallel lines. The top line is “What the Defendant Claims Happened,” and the bottom line is “What the Documents Actually Show.” As you move across the timeline, you can show exactly where the two narratives diverge. This transforms a “he said, she said” argument into a visual demonstration of dishonesty.
3. The Relationship Map
Sometimes the “story” isn’t about when something happened, but who was talking to whom. A relationship map (a web of nodes and lines) helps the jury understand the hierarchy of a corporate entity or the conspiracy in a fraud case.
If you can link a relationship map to a timeline—showing how the network of players shifted over time—you provide a three-dimensional view of the case that a standard oral presentation simply cannot achieve.
Moving from Manual Workflows to Digital Precision
For years, lawyers have created these visuals using a combination of Excel, PowerPoint, and perhaps a very patient paralegal with a highlighter. The problem with this approach is that it’s static.
Let’s be honest: the “final” version of your timeline is usually out-of-date the moment you print it. A witness changes their testimony during a deposition, a new document surfaces in a late-stage production, or the judge rules an exhibit inadmissible. Suddenly, your carefully crafted PowerPoint is a liability.
The Danger of Static Visuals
When you rely on static slides, you’re locked into a rigid presentation. If an opposing attorney asks a question that requires you to jump back to an event three months prior, you have to scroll through twenty slides to find the right one. That break in momentum kills the “narrative transportation” we talked about earlier. It reminds the jury that they are in a choreographed presentation rather than witnessing the truth.
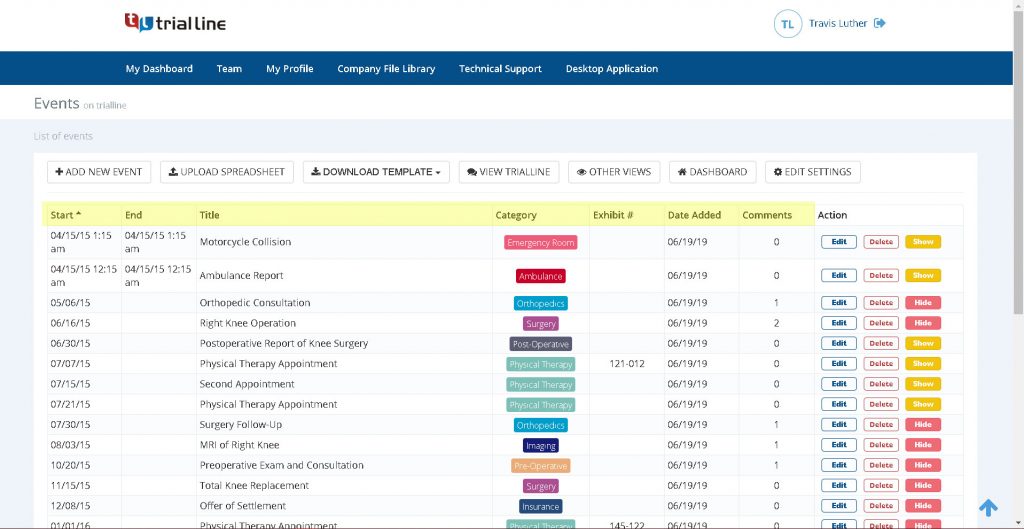
Enter TrialLine: The Living Timeline
This is where a dedicated tool like TrialLine changes the game. Instead of a series of slides, TrialLine provides a cloud-based, interactive environment. Because it’s built specifically for legal professionals, it understands that a case is fluid.
TrialLine allows you to build a unified, chronological sequence of events that is accessible from any device. Instead of flipping through binders, you can pull up the exact event on a tablet or laptop in the courtroom. If you need to show a jury the specific document that proves a timeline point, you don’t have to say, “Let me find that in Exhibit B, page 42.” You simply click the event on the timeline, and the document is right there.
By integrating document discovery directly into the visualization, TrialLine removes the friction between the story (the timeline) and the proof (the evidence).
Step-by-Step: Building a Winning Visual Narrative
If you’re starting a new case, don’t wait until trial prep to start your visual storytelling. The best timelines are grown, not built. Here is a workflow for integrating visual storytelling into your case management from day one.
Phase 1: The “Data Dump” (Discovery Phase)
As you receive documents, don’t just file them by category. Start plotting the “knowns” on a master timeline.
- What to track: Every dated communication, every meeting, every filing, and every reported incident.
- The Goal: To see the “shape” of the case. You might notice that a huge cluster of activity happened in October, but there’s a suspicious silence in November. These patterns often lead to the “smoking gun” questions for depositions.
Phase 2: The “Sifting” (Theory Development)
Once you have the raw data, start filtering. This is where you identify your “critical path.”
- Color Coding: Use colors to denote different themes (e.g., Blue for “Company Policy,” Red for “Violations,” Green for “Internal Warnings”).
- Linking: Attach the actual source document to the event. In TrialLine, this ensures that your visualization isn’t just an assertion—it’s a tethered piece of evidence.
Phase 3: The “Refinement” (Trial Prep)
Now, you create the “jury-facing” versions. You don’t show the jury your master timeline (which likely has 500 entries). Instead, you create curated “views.”
- The Overview: A high-level timeline for your opening statement.
- The Deep Dive: Detailed snippets for direct and cross-examinations.
- The Summary: A final “closing” visual that connects all the dots one last time.
Common Mistakes in Legal Visualizations
Even with the right tools, it’s easy to go wrong. I’ve seen many experienced trial lawyers accidentally alienate juries with their visuals. Here are the pitfalls to avoid.
1. The “Wall of Text”
The biggest mistake is treating a visual aid like a teleprompter. If your timeline slide has paragraphs of text, the jury will stop listening to you and start reading the slide. Humans cannot read and listen effectively at the same time.
- Fix: Use keywords and short phrases. If the event is “Defendant sent a termination letter,” just put “Termination Letter.” You provide the context orally.
2. Over-Complexity and “Chart Junk”
Avoid using 3D effects, excessive gradients, or distracting animations. If a juror has to spend five seconds wondering what a specific symbol means, you’ve lost them.
- Fix: Stick to a clean, professional palette. Use high contrast (dark text on a light background). The visual should be a bridge to the evidence, not the destination.
3. Lack of Consistency
If you use a red dot to represent a “warning” on slide one, but a red square to represent a “violation” on slide five, you confuse the jury. They will spend their energy trying to decode your system rather than listening to your argument.
- Fix: Create a simple legend and stick to it throughout the entire trial.
4. Ignoring the “White Space”
There is a temptation to fill every inch of the screen. However, white space is a tool. It provides visual breathing room and tells the jury, “This is a distinct chapter of the story.”
- Fix: Group related events into “clusters” with space between the clusters. This helps the jury mentally categorize the stages of the case (e.g., “The Negotiation Phase” vs. “The Breach Phase”).
Worked Example: Applying Visual Storytelling to Different Case Types
To make this concrete, let’s look at how these techniques apply to three common legal scenarios.
Scenario A: Personal Injury (The “Negligence Gap”)
In a slip-and-fall case, the defense often claims they had a “reasonable” inspection schedule.
- The Visual: A timeline showing the scheduled inspection times (represented by grey markers) and the actual time of the accident (a bold red marker).
- The Narrative: By showing a 6-hour gap between the last “inspection” and the accident, you visually demonstrate that the “reasonable” schedule was a fiction. The gap becomes the evidence of negligence.
Scenario B: Employment Dispute (The “Retaliation Sequence”)
In a whistleblower case, timing is everything. The defense will argue the employee was fired for “poor performance,” not for reporting a violation.
- The Visual: A parallel timeline. Top track: The employee’s performance reviews (showing “Exceeds Expectations” for three years). Bottom track: The dates the employee filed internal complaints.
- The Narrative: When the “Termination” event occurs exactly two weeks after a “Whistleblower Report,” and immediately after a glowing performance review, the visual sequence creates an undeniable inference of retaliation.
Scenario C: Commercial Litigation (The “Complex Contract Breach”)
In a case involving a multi-year partnership and a series of failed deliverables, the facts are often a mess.
- The Visual: A “Milestone Timeline” using TrialLine to group sequences of events. Group 1: The Agreement. Group 2: The Early Successes. Group 3: The First Breach. Group 4: The Failed Cures.
- The Narrative: By categorizing the chaos into “Chapters,” you turn a complex business dispute into a story of a promise made and a promise broken.
Comparing Visual Methods: A Quick Reference
| Method | Best For… | Jury Impact | Potential Pitfall |
| :— | :— | :— | :— |
| Linear Timeline | Establishing a sequence of events | High (Easy to follow) | Can become cluttered/boring |
| Parallel Tracks | Impeaching testimony vs. facts | Very High (Creates contrast) | Can seem too “aggressive” if overused |
| Relationship Map | Showing corporate hierarchy/collusion | Medium (Explains “Who”) | Can look like a “spiderweb” if too complex |
| Milestone Groups | Long-term cases with multiple phases | High (Provides structure) | Missing a key event in a group |
Using Technology to Maintain the “Single Source of Truth”
One of the hardest parts of trial work is ensuring that the version of the story you’re telling in the courtroom matches the version in your motions and the version your co-counsel is presenting.
When a team uses separate spreadsheets and slide decks, “version drift” happens. Partner A is using the timeline from Tuesday, while Associate B is using the updated version from Thursday. In a high-stakes trial, this inconsistency can be fatal. If a witness identifies a date that contradicts your current slide, you look unprepared.
The Cloud Advantage
This is why the cloud-based nature of TrialLine is more than just a convenience—it’s a risk-mitigation strategy. When your timeline lives in a centralized, cloud-based platform:
- Real-Time Updates: If a piece of evidence is thrown out, you remove it from the master timeline once, and it’s gone for everyone on the team.
- Collaborative Input: Your paralegals can add document links as they find them, and you can refine the narrative labels in real-time.
- Device Flexibility: You can move from the laptop at the counsel table to a tablet while walking toward the jury box without losing your place in the story.
FAQ: Common Questions on Visual Case Storytelling
Q: Will using too many visuals make me look like I’m trying to “trick” the jury?
A: Not if the visuals are grounded in evidence. The key is to use them as aids to the testimony, not as replacements for it. When you say, “As you can see on the timeline, the email was sent on Tuesday,” and you actually show the email, you’re not tricking them—you’re helping them.
Q: How do I handle a timeline when the dates are uncertain?
A: Use “Approximate” markers or ranges. Instead of a single point on a line, use a shaded block that represents a window of time (e.g., “Sometime between June 1st and June 15th”). This maintains your honesty with the jury while still providing a visual structure.
Q: What is the best way to introduce a visual to the jury for the first time?
A: Introduce it during your opening statement as the “Map of the Case.” Tell them, “Throughout this trial, we will refer back to this sequence of events to keep us all on the same page.” This sets the expectation and makes the jury welcome the visual as a tool for their own understanding.
Q: Should I print physical copies of my timelines for the jurors?
A: If the court allows it, yes. While digital presentations are great for the “big picture,” having a high-quality printed timeline at their desk allows jurors to make their own notes and “mark up” the story as they hear the evidence.
Q: How do I deal with an opposing counsel who tries to “muddy the waters” by adding irrelevant dates to my timeline?
A: This is where the “Critical Path” and TrialLine’s filtering come in. You can acknowledge the other event but visually keep it in the “background” or a different color, while keeping your critical evidence highlighted. If the evidence is truly irrelevant, you can use the visual to show why it doesn’t impact the main sequence of events.
Final Takeaways: Turning Facts into a Win
Visual storytelling isn’t about art; it’s about clarity. In a courtroom, clarity is power. When you reduce the cognitive load on a jury, you make it easier for them to agree with you. You move from being a presenter of facts to a guide through a narrative.
To recap the winning strategy:
- Plan the Arc: Identify your critical path and the “gaps” that prove your point.
- Simplify the Visuals: Avoid the “wall of text” and stick to a consistent, clean design.
- Use the Right Tools: Stop relying on static slides. Pivot to a dynamic, cloud-based system like TrialLine that allows you to link evidence directly to events and update your story in real-time.
- Stay Agile: Be ready to zoom in on details or zoom out to the big picture depending on the witness’s testimony.
The goal of a trial is to leave the jury with a clear, undeniable understanding of what happened. By using visual storytelling techniques, you aren’t just telling them the truth—you’re showing it to them.
If you’re tired of wrestling with clunky spreadsheets and outdated slide decks, it’s time to modernize your approach. Check out TrialLine and see how purpose-built legal timeline software can help you organize your case, align your team, and ultimately, win over your jury.